How to Analyze Ransomware Trends in Q1 2026: A Step-by-Step Guide
Step-by-step guide to interpreting Q1 2026 ransomware trends: volume stabilization, consolidation of power among top groups, breakout actors, and how to adjust for misleading yearly comparisons.
Introduction
Ransomware activity in the first quarter of 2026 reveals a landscape that is both stabilizing in volume and shifting in structure. While the total number of victims posted on data leak sites (DLS) remains high, the most notable change is the consolidation of power among a smaller set of dominant groups. This guide walks you through the key data points and trends so you can interpret what the numbers really mean, whether you're a security professional, an executive, or simply following cybersecurity developments. By the end, you'll have a clear framework to evaluate quarterly ransomware reports and spot the signals that matter.
What You Need
Before diving in, gather the following materials and background knowledge:
- Access to DLS monitoring data – At least 70 active leak sites tracked over Q1 2026 (January–March).
- Historical quarterly figures – Specifically Q1 2024, Q1 2025, Q4 2025, and Q1 2026 victim counts.
- List of top ransomware groups – Including their victim counts for Q4 2025 and Q1 2026.
- Details on the Cl0p mass-exploitation campaign – Approximately 390 victims added in Q1 2025 via Cleo vulnerability.
- Understanding of fragmentation vs. consolidation – Recognise that fewer active groups with higher market share indicates consolidation.
- Patience for context – Raw numbers can mislead; always check the underlying story.
Step-by-Step Analysis
Step 1: Assess the Overall Victim Volume
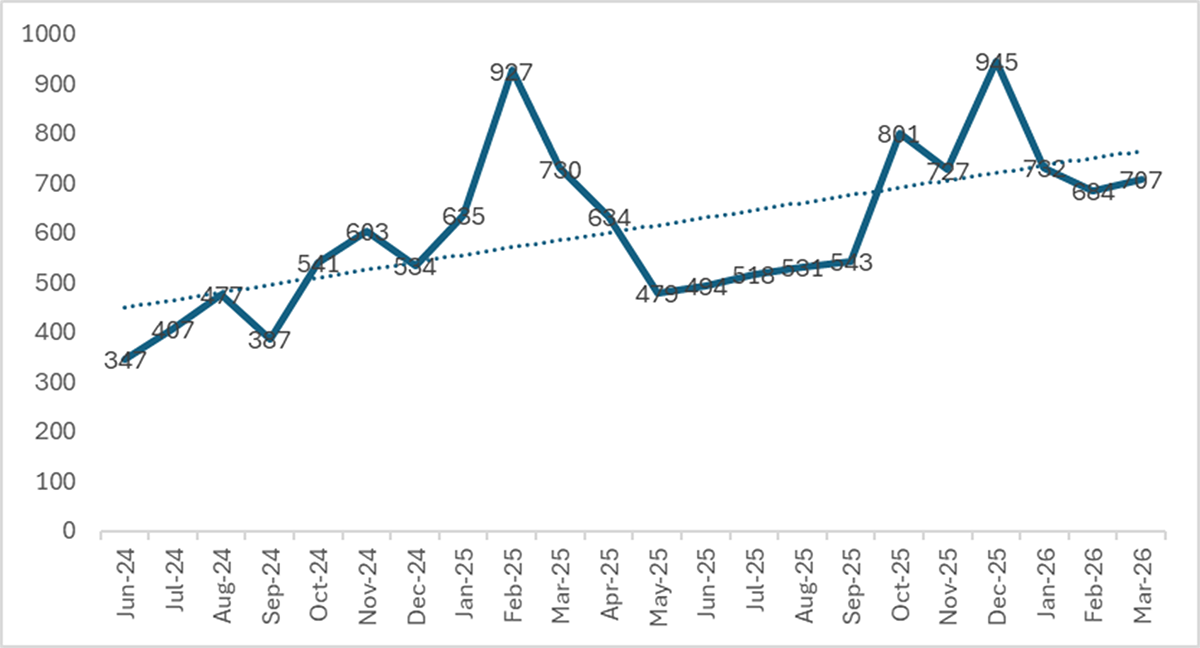
Start by looking at the total number of victims posted on DLS. In Q1 2026, there were 2,122 victims – the second-highest Q1 on record. Compare this to the all-time record of 2,416 in Q4 2025 (a 12.2% drop) and to Q1 2024 with just 977 victims. Although the quarterly number fell from the previous period, it is 117% above the Q1 2024 baseline. Monthly figures are stable: January (732), February (684), March (706) – an average of 707 per month. This tells you that the ransomware engine is operating at a sustained high rate, not spiking wildly.
Step 2: Adjust for Distortions with Year-over-Year Comparison
Headline year-over-year (YoY) numbers show a 7.1% decline from Q1 2025’s 2,285 victims to Q1 2026’s 2,122. But this is misleading because Q1 2025 was inflated by Cl0p’s Cleo mass-exploitation campaign, which added roughly 390 victims in a single event. To get a fair view, remove Cl0p from both periods: Q1 2025 becomes 1,894 victims, Q1 2026 becomes 1,995 victims – a real YoY increase of 5.3%. The underlying growth trend persists; the dramatic spikes are just smoothing out.
Step 3: Examine the Consolidation Trend
Now shift focus from volume to structure. The ransomware ecosystem had been fragmenting for two years – the number of active groups grew from 51 in Q1 2024 to 85 in Q3 2025, while the top-10’s share of victims fell from 68% to 57%. In Q1 2026, that trend reversed sharply. The top 10 groups now account for 71.1% of all DLS-posted victims – the highest concentration since early 2024. Meanwhile, the total number of active groups shrank from 85 to 71. Fourteen groups that were active in Q4 2025 disappeared entirely, and 21 new ones appeared. This signals consolidation: fewer, more dominant players are absorbing the market.
Step 4: Identify the Dominant Operators
Within the consolidating landscape, certain groups stand out. Qilin maintained its top position for the third consecutive quarter, posting 338 victims – this shows sustained operational capacity. The Gentlemen is the breakout story of Q1 2026: their victim count jumped from 40 in Q4 2025 to 166, catapulting them to third place globally. LockBit 5.0 also made a comeback, posting 163 victims and climbing to fourth place. These three groups, plus others in the top 10, illustrate the shift toward bigger players.
Step 5: Evaluate Monthly Stability
Look at the monthly rhythm within the quarter. January (732), February (684), March (706) show a consistent monthly volume around 707 victims. There is no single month spike; the activity is uniform. This stability indicates an operational baseline that has become the new normal. Compare to previous quarters where large campaigns caused peaks. The absence of such peaks in Q1 2026 reinforces the idea of consolidation and maturity in the ransomware economy.
Step 6: Interpret the Fragmentation-to-Consolidation Cycle
Finally, combine all observations. The key structural development is not the volume but the consolidation. After fragmentation allowed many groups to emerge, the ecosystem is now weeding out weaker players. The top 10’s share rising from 57% to 71% in just two quarters, while total groups drop from 85 to 71, shows that the market is concentrating power. This mirrors other criminal ecosystems where successful groups absorb others’ victims through better TTPs, partnerships, or sheer reach. For defenders, this means fewer but more sophisticated and resilient adversaries.
Tips for Analysing Future Quarters
- Never trust the headline YoY figure without adjusting for mass-exploitation campaigns. Always check for outlier events like Cl0p’s Cleo campaign that can skew comparisons.
- Track the number of active groups and top-10 share as leading indicators. A rising top-10 share portends increased professionalism and longer dwell times.
- Monitor disappearance and appearance of groups. When 14 groups vanish and 21 appear in one quarter, the churn signals realignment – watch for which new groups climb fast.
- Look at monthly distribution – steady volumes suggest a mature operation; volatile numbers often accompany new exploit campaigns or law enforcement disruptions.
- Consider the human element. The rise of The Gentlemen and LockBit 5.0 shows that brand reputation and continued innovation still matter in ransomware.
- Use the average victim per month as a baseline. In Q1 2026 that baseline was 707 victims/month. Any quarter that deviates more than 15% from this deserves extra scrutiny.
By following these steps and tips, you can turn raw DLS data into actionable intelligence about the state of ransomware. The Q1 2026 story is one of consolidation at scale – a reminder that even in a high-volume environment, the structure of the threat landscape evolves rapidly. Stay alert, adjust your defenses for fewer but more capable adversaries, and always question the numbers.